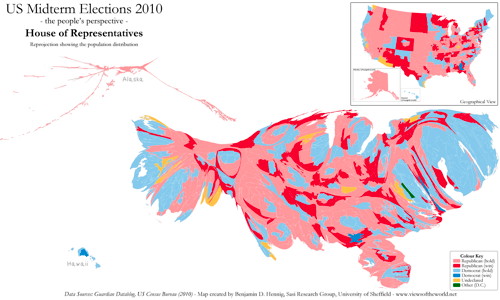
Benjamin Hennig has plotted the results of the U.S. congressional elections on a population-based cartogram (which evens out the very large, sparsely populated districts with the small, densely populated urban districts that don’t show up well on a geographical map). There are cartograms for the Senate and governors’ races, too, but they’re less dramatic. Via @worldmapper.
Cartograms of the 2010 U.S. Midterms first appeared on The Map Room: A Weblog About Maps on November 6, 2010. Copyright © 2010 Jonathan Crowe. Distributed under a Creative Commons licence.
Post originale: http://www.mcwetboy.net/maproom/2010/11/cartograms_of_t.php
No comments:
Post a Comment